ops
Python · FastAPI · HTMX · Chart.js · SQLite · Docker · Telegram
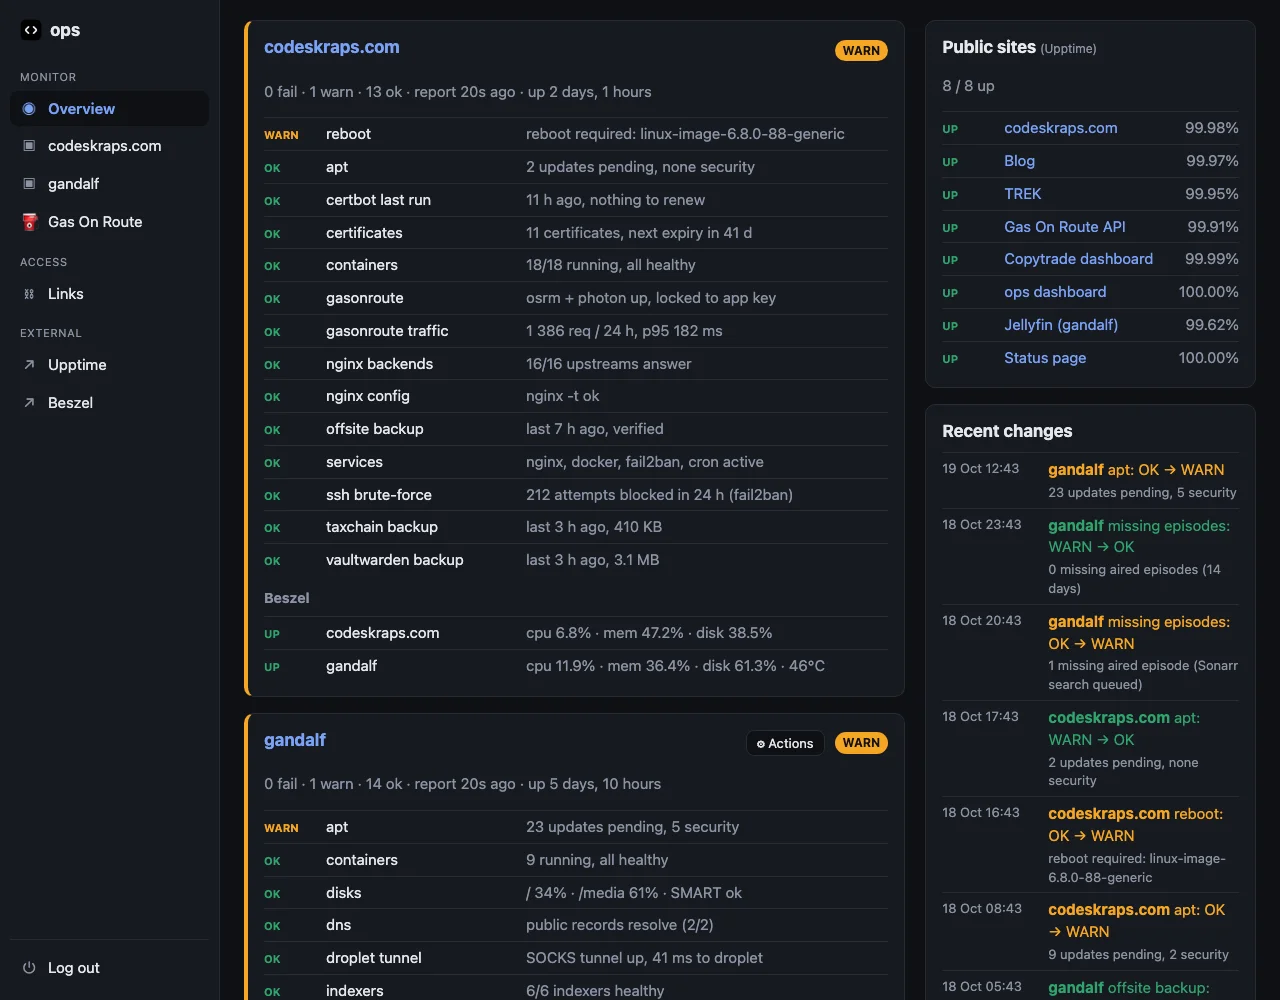
A health and status dashboard for my two servers, the droplet behind this site and the media box at home. A small agent on each machine runs its checks every five minutes and posts the results, and the dashboard keeps the history. Screenshots are from a local copy with made-up data.
Features
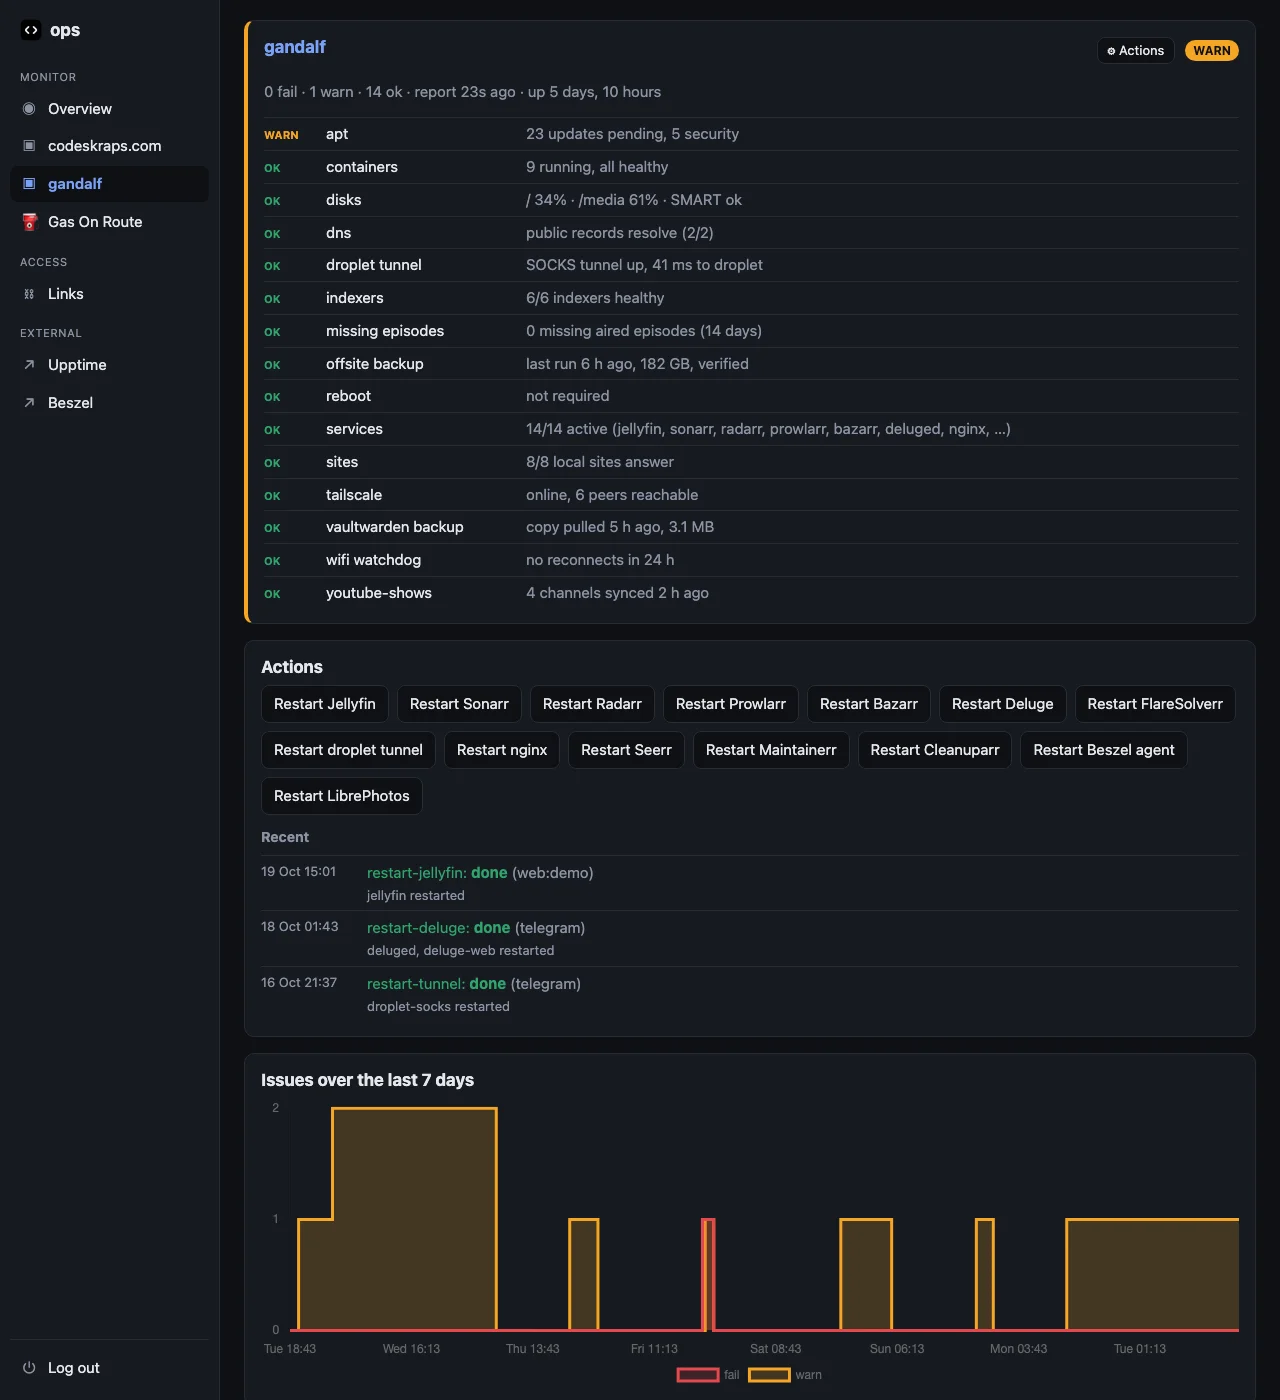
- Per-host checks with a change log and a seven-day chart of warnings and failures
- Telegram alerts when a check changes level (only after two reports in a row, so one blip doesn’t wake me), when it recovers, when a host stops reporting and when a public site goes down, plus a morning digest while something is still open
- Restart actions: a fixed list of safe restarts that the host’s own agent picks up and runs, with expiry, rate limits and a confirmation step; also from a Telegram bot
- Uptime and metrics in one place: site status from my Upptime page and system stats from Beszel
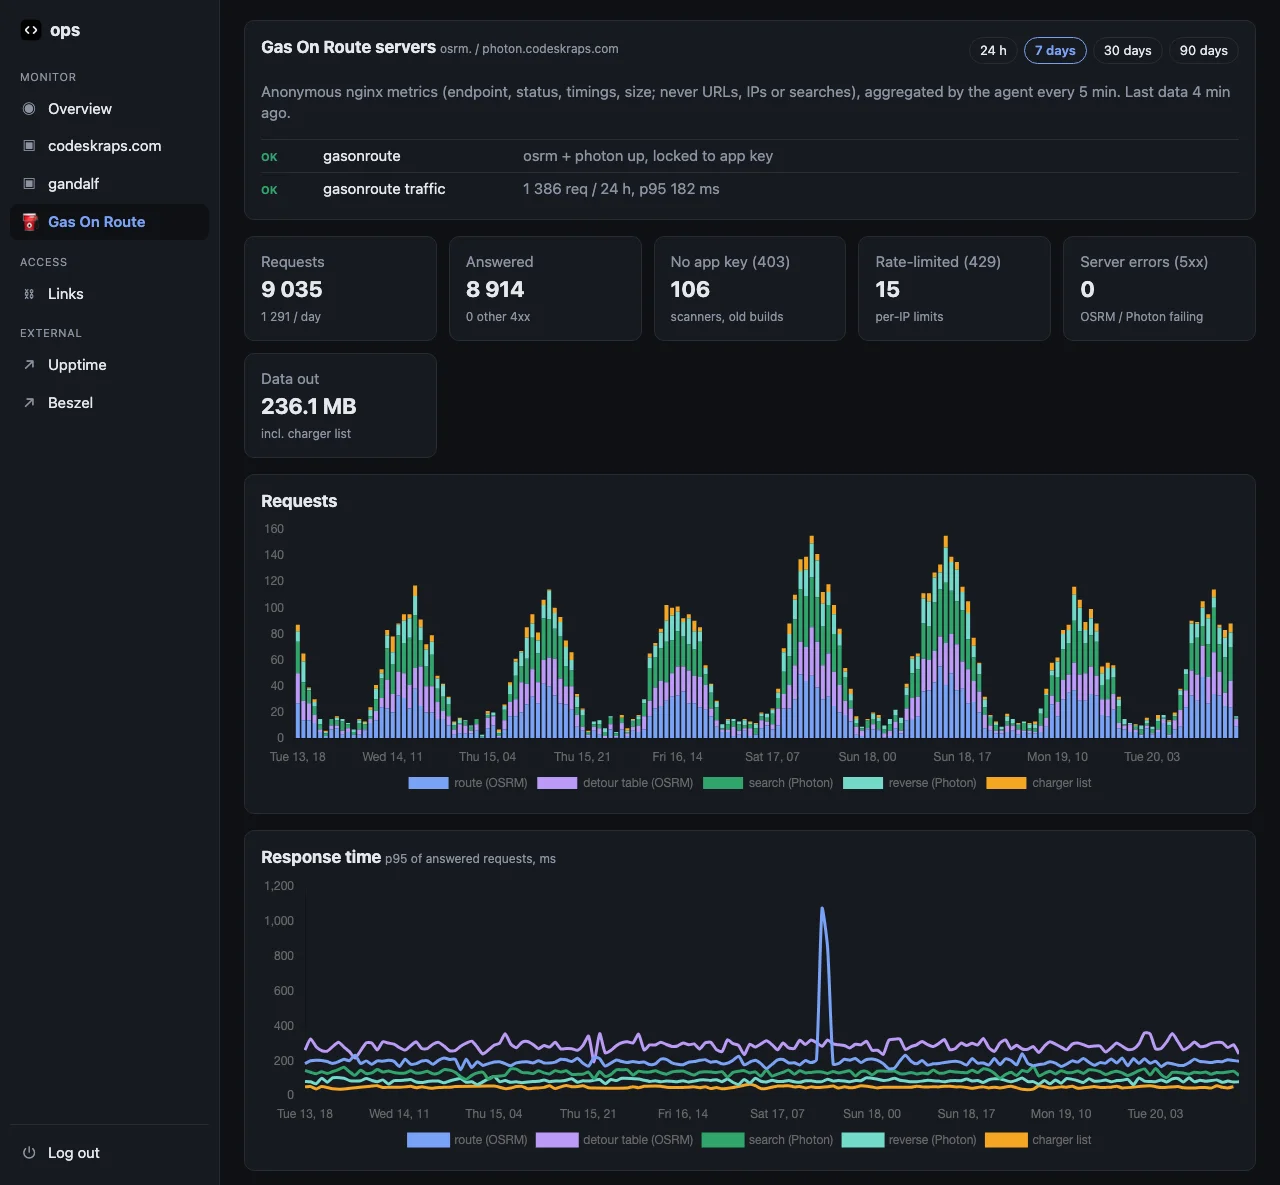
- Gas On Route traffic: anonymous request counts and response times for the app’s routing and search servers, never URLs, IPs or searches
- Locked down: password plus TOTP, per-IP lockout feeding fail2ban, CSRF tokens, a strict content security policy, and a separate token per reporting host, stored only as a hash